The Sound of Emergence
Sonifying a Phase Transition
Life in a (non) analytical world
Imagine taking a glass of water at room temperature and cooling it by 1 degree. At first glance, the system would look almost identical, beyond feeling slightly colder when touched. At a second glance, a physicist or a chemist might be able to measure some differences in a set of measurable quantities such as the heat capacity, but overall the intensity of these changes would be proportional to the decrease in temperature.
Indeed in ordinary life we expect physical laws to be well behaved: we have internalised the idea that the effects of an action are generically proportionate to its intensity, that observables do not change abruptly but vary continuously. Let us call the world that evolves under these expectations analytic.
Now repeat the same experiment with a glass of water that sits right above the freezing temperature. Your faith in analyticity will be torn apart. Everything about the object changes at once: its rigidity, its density, the way it reflects and absorbs light. A small change in temperature has produced a huge physical transformation.
These types of phenomena, called Phase Transitions, have fascinated physicists for centuries, precisely because of their non-analyticities. They cannot be understood from the individual properties of the atoms alone, but require an understanding of the interaction between many such atoms, and are therefore an example of emergent phenomena.
In this article, we will explore some of the most striking properties of phase transitions, using the Ising Model as our prototypical example. We will examine how its properties change not only from a visual perspective but also an auditory one, using the art of data sonification to translate key parameters of the model into sound.
The Ising Model
At the end of the XIX century, the French physicist Pierre Curie described a new phase transition: he observed that certain materials, below a certain temperature (which varies across materials), acquired spontaneous magnetisation. In an attempt to explain the core mechanism of this transition, in 1925 a German physicist called Ernst Ising proposed a model which now bears his name.
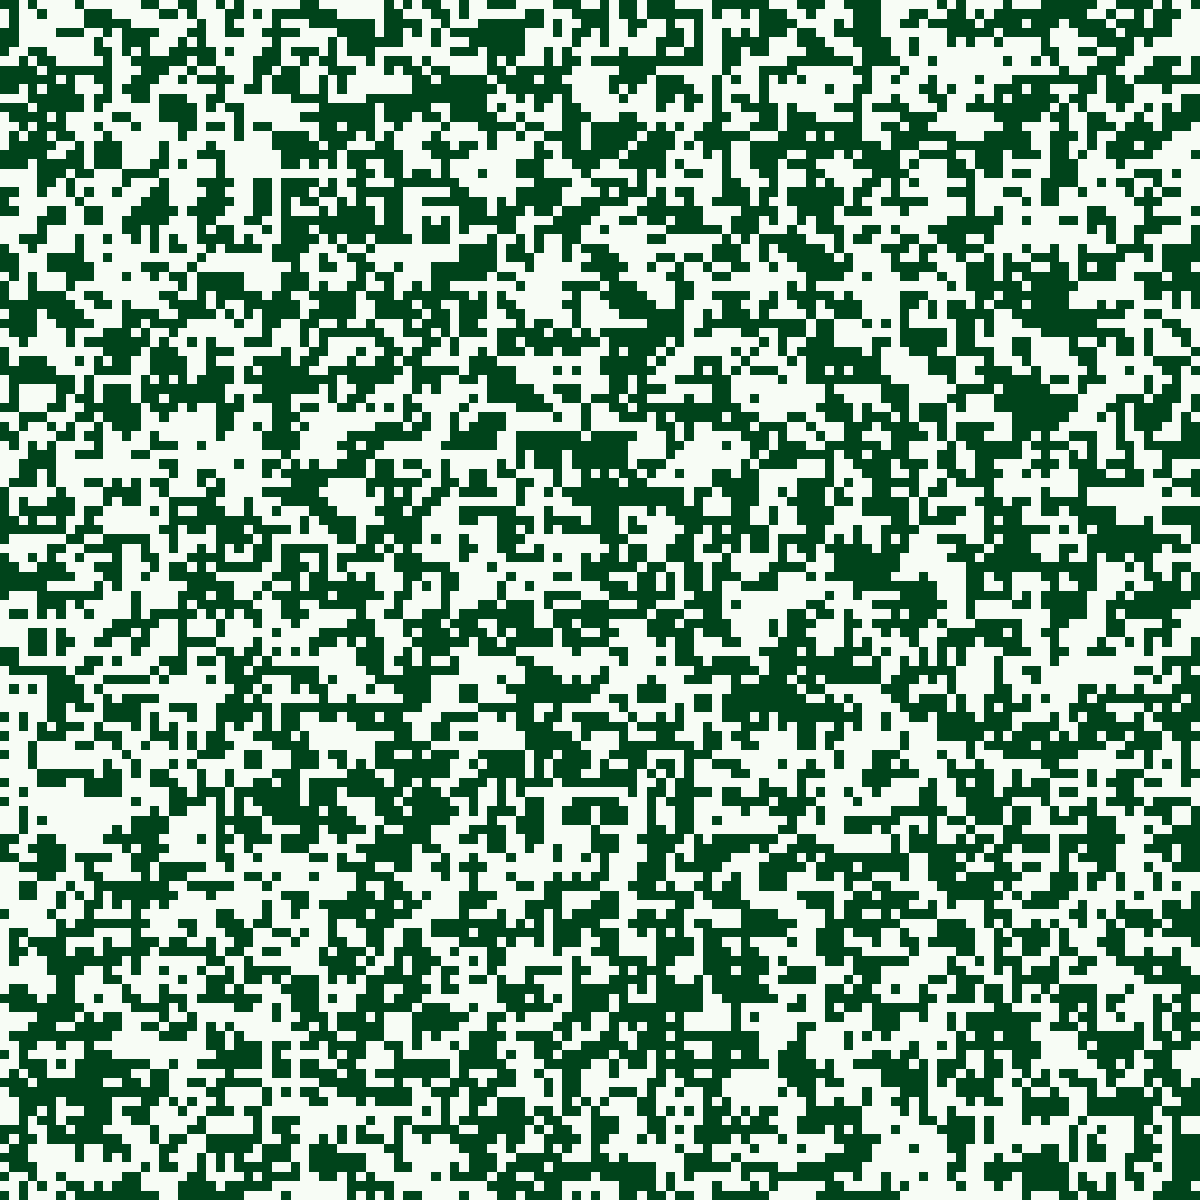
The Ising Model is an extremely simplified model of magnetism: it is defined on a 2d grid of pixels, where each pixel can be in one of two states, “up” or “down”, representing the orientation of a tiny magnetic spin. Each spin interacts only with its immediate neighbours, and the interaction prefers alignment: neighbouring spins lower their energy by pointing the same way. The parameter that controls the strength of this alignment preference is the temperature T, low temperature corresponding to a high alignment strength and vice versa.
The macroscopic state of the model is captured by an observable called the magnetisation m. It is defined as the number of “up” spins minus the number of “down” spins, divided by the total amount of spins. When there are roughly the same amount of up and down spins m = 0, and we are in the so-called “Paramagnetic Phase”; when there is a macroscopic majority of “up”/”down” spins m is positive/negative and we are in the so-called “Ferromagnetic Phase”.
Like the materials observed by Curie, the Ising model exhibits a phase transition where decreasing the temperature below a certain threshold T = 2.269 brings the system from a disordered paramagnetic to a partially ordered ferromagnetic state. Indeed when there is a majority of spins pointing in one direction, the individual magnetic fields of all atoms sum and become macroscopic, therefore leading to the material developing spontaneous magnetisation.
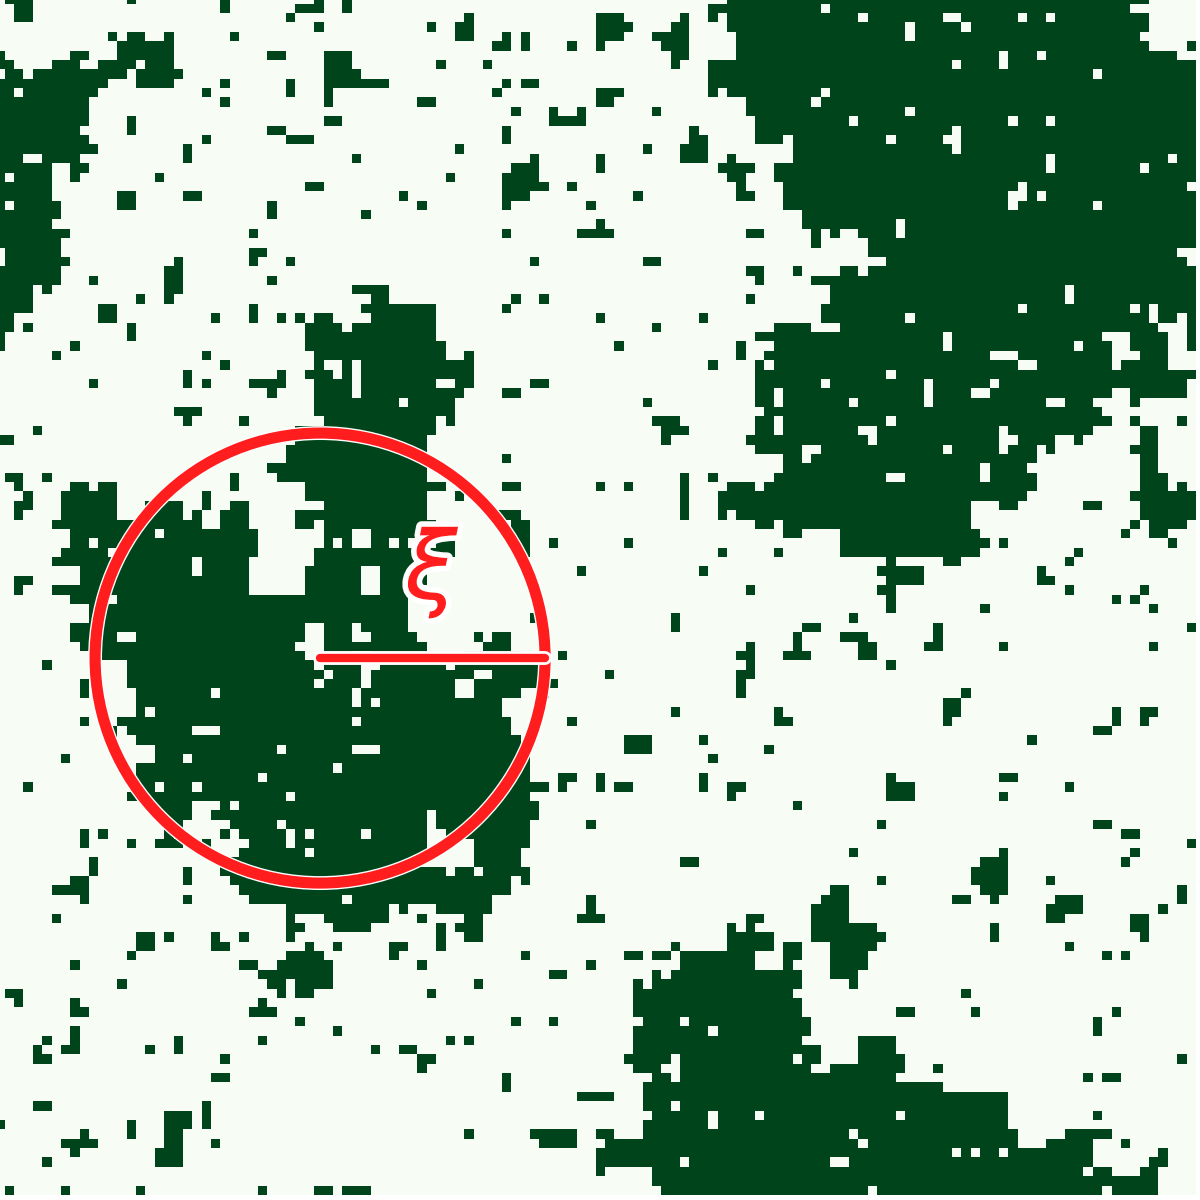
Although the magnetisation measures the degree of global order, there still could be order on smaller scales. This “local” order is captured by the correlation length ξ. Roughly, this measures the distance at which spins are correlated, in the sense that they have a high probability of being both up or down. For example in the image on the left, the correlation length is roughly the radius of the red circle: although the total magnetisation is zero, there is local order on scales of order ξ.
Data Sonification
Data sonification is the practice of transforming data into audio. Its objective is to communicate aspects of that data through the medium of sound.
In this project, the aim is to understand phase transitions, but also to perceive them from a visual/auditory perspective. Visualising the Ising Model is straightforward, as each microscopic state can be represented with a 2d grid of white and green pixels. Translating the state of the system into sound instead requires a mapping. In this mapping lies the art of data sonification.
The mapping is constructed such that the statistical properties of the model are reflected by its sound: each spin plays a fixed note whose pitch is higher/lower if the spin is “up”/“down”. The decay and detunement are controlled by the amount of disagreement with its neighbours, such that a spin that disagrees is short and detuned. The correlation length is then mapped to the cutoff frequency of a low pass filter, such that the degree of local order controls the overall brightness. In this way, the overall sound emerges from the interaction rules between many simple voices.
Let us now understand and listen to the different phases that occur in this model.
Disordered Paramagnetic Phase
At high enough temperature, the interaction between spins is weak and the model is in a disordered “Paramagnetic” phase, where both the magnetisation and the correlation length are close to zero.
Spins are not aligned to their neighbours, so every voice is fast and detuned. The result is a neurotic texture, statistical noise heard as sound.
Ferromagnetic “up” Phase
At low temperature, the alignment is strong enough that the lattice collectively freezes in a ferromagnetic state, where the magnetisation is close to 1. This is a clear example of emergence: macroscopic order has emerged from the details of the microscopic interaction.
Nearly every spin is aligned with its neighbours, so every voice plays a long note that is in tune. Because the magnetisation is positive, most spins are “up”, the voices sit in the upper register.
Ferromagnetic “down” Phase
At the same low temperature, nothing in the model distinguishes “up” from “down”: the interaction rewards alignment without preferring a direction, so the two ordered states are exactly equivalent in energy. Which of them is realised depends on the entire history of the model. Under identical conditions the system may descend into the spin “down” state instead, with negative magnetisation, a perfect mirror of the ordered up phase. In Physics, this is called spontaneous symmetry breaking: the laws governing the system retain a symmetry (m → −m) that the realised state does not.
The sonic signature is the same harmonic pad, but because the magnetisation is now negative the voices sit in the lower octave.
Critical Phase
Let us now explore the interface between these phases. To the left, we are gradually decreasing the temperature, something physicists call annealing, and going from a disordered to an ordered “up” phase. Precisely at the boundary between these two, at Tc = 2.269, we reach the critical phase. This is the most interesting phase: the grid appears to form complex patterns, and although the total magnetisation is zero, coherent patches start to form. Indeed in this phase the correlation length reaches its maximum, and the system develops long range order. Because distant spins are very correlated, a local perturbation can propagate very far, and the system becomes maximally responsive. This susceptibility has many analogies in natural systems such as brains and flocks of birds, where reaction speed to external stimuli plays a very important role.
Correspondingly the sound is neither dominated by neurotic arpeggios nor by warm pads, but instead develops complex harmonies, that persist until the system is cooled into the pad-like sound of the ferromagnetic state.
Metastable Phase
What happens if, instead of cooling the system slowly, we drop the temperature abruptly? On the left, the lattice is quickly cooled from T = 3.5 to T = 0.5, something physicists call a quench. Order starts to appear at local scale, but the temperature decrease is so fast that information doesn’t have time to flow from one patch to another. Each region picks “up” or “down” on its own, and instead of settling into one of the two ferromagnetic phases, the lattice gets trapped in wide stripes of opposite magnetisation. This is a metastable state: it is not the state of lowest energy, but a suboptimal one in which the system gets stuck and, at such low temperature, can remain for a very long time. For a sufficiently strong external perturbation however, the system can return to its ferromagnetic equilibrium state.
Inside each stripe almost every spin agrees with its neighbours, so the overall sound is a superposition of the “up” and “down” ferromagnetic states. Disagreement survives only at the boundaries between stripes, where the few spins sitting on a domain wall keep plucking quick detuned notes, a reminder of the tension such a wall carries.
Conclusions
We started from a glass of water and the expectation that small causes produce small effects. The Ising Model shows how this expectation breaks down: a single, local rule, in which each spin prefers to agree with its neighbours, is enough to produce distinct phases of matter and abrupt transitions between them. None of these phases is written into the rule itself: they emerge from the interaction of many spins, and only become visible, or audible, at the scale of the whole lattice.
Listening to the model gives these ideas a different texture. Disorder is heard as a neurotic arpeggio, order as a harmonic pad whose octave reveals which way the symmetry has been broken, and a quench as a pad that never quite resolves. At the critical point, where the correlation length spans the entire grid, the sound is at its richest, because structure is present on every scale at once. This is also where physics is at its most surprising: near their critical points, systems as different as magnets and fluids share the same critical behaviour, a property known as universality. The Ising Model is a drastic simplification, but the phenomena it captures are real, and data sonification offers one more way to perceive them: with our ears as well as our eyes.
Under the Hood
The model is sampled using standard Markov Chain Monte Carlo sampling via Python. The data is then sent to SuperCollider via UDP. To listen to it, 64 of the spins are sent to a detuned saw wave oscillator that plays a fixed note of a five-note minor chord, with up and down spins placed two octaves apart. The decay of the envelope and the amount of the detune are set by the spin’s agreement with its neighbours: a spin that disagrees is given a short detuned sound, while one that agrees a clean slow pad sound. The correlation length acts globally on the filters, and since it peaks only at the critical point, the instrument opens up there and closes again on either side.